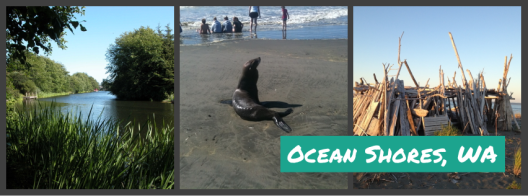
 Greetings from the beach…
2015 has been the second greatest year for real estate sales in the history of Ocean Shores. Double-digit growth for sales activity and double-digit average sales prices increases for homes, condos and vacant lots. This has been the best year for sales activity and price gains since the biggest boom year of 2005. Home, condo and land sales all went up. Home inventory is way down. Ocean Shores home prices for 2016 should see double digit growth again.
Check out my new Ocean Shores Video!

Ocean Shores Residential Sales
Ocean Shores home sales increased over 25% in 2015 up 1% from a 24% increase last year. That’s an increase of 49% in the past two years! 310 homes sold last year up from 247 in 2014. We haven’t seen this many residential sales since 2005 when 318 homes had sold. Home prices jumped 13.7% compared to 2014’s increase of 3.1%. The most expensive home to sell in 2015 was an ocean front that fetched $620,000. Just over 11% of our home sales were foreclosures in 2015. That number was 18% in 2013/2014 and 26% in 2012. The great news for now though is that only 2 (or 1.5%) homes on the market today are bank-owned compared to 9.2% last year at this time.
2015 Home Sales
The average home that sold last year in Ocean Shores was 1,496 square feet and took 148 days to sell compared to 1,438 square feet and 229 days in 2014. 63 homes sold in 30 days or less compared to 40 in 2014. One house took 1,592 days to sell… There are only 127 homes on the market right now compared to 184 homes last year at this time. This is an inventory decrease of 31%! ~ Average list price: $214,989 (it was $206,775 last year at this time) ~ Average of 241 Days on Market compared to 286 days last year. One has been on the market for 3,767 days now (that’s almost 10 years!) and no, it’s not my listing. Matter of fact, that house did go pending a month ago, but then kicked out…I don’t know why. There were 28 Homes pending on January 1st compared to 23 last year at this time… ~ Average list price of those: $168,500 compared to $150,483 in 2014.
OS Annual Home Sales
* 310 Homes sold in 2015 for an average sales price of $173,143 (cheapest was $24,400 – most expensive was $620,000).
* 247 Homes sold in 2014 for an average sales price of $152,257 (cheapest was $17,000– most expensive was $565,000).
* 199 Homes sold in 2013 for an average sales price of $147,568 (cheapest was $25,000 – most expensive was $385,000).
* 169 Homes sold in 2012 for an average sales price of $138,995 (cheapest was $12,000 – most expensive was $580,000).
* 169 Homes sold in 2011 for an average sales price of $143,192 (cheapest was $32,905 – most expensive was $405,000).
2015 Quarterly Home Sales
* 67 Homes Sold during 4th Quarter 2015 ~ Average Sales Price: $203,003 ~ Average of 148 Days on Market. Price Range: $24,400 – $620,000.
* 91 Homes Sold during 3rd Quarter 2015 ~ Average Sales Price: $166,771 ~ Average of 139 Days on Market. Price Range: $40,000 – $369,000.
* 97 Homes Sold during 2nd Quarter 2015 ~ Average Sales Price: $175,479 ~ Average of 149 Days on Market. Price Range: $30,000 – $464,000.
* 51 Homes Sold during 1st Quarter 2015 ~ Average Sales Price: $143,694 ~ Average of 262 Days on Market. Price Range: $25,000 – $360,000.
* 54 Homes Sold during 4th Quarter 2014 ~ Average Sales Price: $170,990 ~ Average of 196 Days on Market. Price Range: $17,000 – $565,000.
 Ocean Shores Condo Sales
2015 was a great year for condo sales in Ocean Shores. 33 Condos sold compared to 17 last year – an increase of almost 100%! Average sales price jumped as well from $84,876 to 128,013 or a 50% increase. The reason for the big jump in condo sales is because of the Oyhut Bay renovations that have taken place at the foreclosed on Villages project. Condo inventory is way up compared to last year. There are only a few Ocean View/Ocean Front condos available. Most of the available condos on the market right now are “condotels” – such as the Canterbury, Grey Gull, Polynesian, etc. Three condotels sold last year compared to none the year before. Hopefully, more of them will sell in 2016. Prices are very good for them historically speaking.
2015 Condo Sales
The average condo that sold last year in Ocean Shores was 1,034 square feet and took 162 days to sell compared to 886 square feet and 246 days in 2014. Only 2 out of the 33 condos sold last year were foreclosures. There are only 52 condos on the market (29 last year) for an average list price of $122,952 (compared to $114,882 last year). Six condos are currently pending for an average list price of $103,975.
OS Annual Condo Sales
* 33 Condos sold in 2015 for an average sales price of $128,013 (cheapest was $24,000 – most expensive was $269,000).
* 17 Condos sold in 2014 for an average sales price of $84,876 (cheapest was $15,000 – most expensive was $180,000).
* 19 Condos sold in 2013 for an average sales price of $123,197 (cheapest was $27,900 – most expensive was $287,000).
* 17 Condos sold in 2012 for an average sales price of $107,191 (cheapest was $25,000 – most expensive was $215,000).
* 17 Condos sold in 2011 for an average sales price of $141,906 (cheapest was $5,000 (time share) – most expensive was $224,900).
2015 Quarterly Condo Sales
* 14 Condos Sold during 4th Quarter 2015 ~ Average Sales Price: $140,650 ~ 105 Days on Market. Price Range: $27,000 – $269,000.
* 12 Condos Sold during 3rd Quarter 2015 ~ Average Sales Price: $137,109 ~ 130 Days on Market. Price Range: $44,500 – $200,000.
* 5 Condos Sold during 2nd Quarter 2015 ~ Average Sales Price: $68,840 ~ 423 Days on Market. Price Range: $24,000 – $110,000.
* 2 Condos Sold during 1st Quarter 2015 ~ Average Sales Price: $140,000 ~ 428 Days on Market. Price Range: $45,000 – $190,000.
* 7 Condos Sold during 4th Quarter 2014 ~ Average Sales Price: $67,071 ~ 259 Days on Market. Price Range: $15,000 – $127,000.
 Ocean Shores Vacant Lot Sales
2015 was an excellent year for lot sales in Ocean Shores. Vacant land sales increased over 40% this past year at the beach. In fact, there haven’t been this many lot sales in Ocean Shores since 2007. Average price increased just over 17%. Like last year, a lot of sellers dropped their prices to unload these lots to really low prices which did motivate numerous buyers to take advantage of the cheap pricing. Eighty-four (77 last year) of the 268 lots sold last year for $10,000 or less… There are still a lot foreclosed lots available in Ocean Shores. If you would like a copy of the lot foreclosure list, feel free to respond to this and I’ll email it to you. Inventory is up 13.1% over last year’s increase of 22.6%. This number will decrease this year. There are 51 (89 last year) lots listed for $10,000 or less presently… As this number continues to go down, prices are going to start going up…
2015 Vacant Lot Sales
There are 612 (541 last year) lots on the market right now for an average list price of $30,946 ($39,202 last year). 225 of those are foreclosure lots owned by the City. There are 8 (12 last year at this time) lots currently pending for an average list price of $25,381. It took 354 days to sell a vacant lot in 2015 compared to 283 days the year before. One lot took 2,140 days to sell…
OS Annual Lot Sales
* 268 Lots sold in 2015 for an average sales price of $23,385 (cheapest was $3,000 – most expensive was $200,000).
* 191 Lots sold in 2014 for an average sales price of $19,971 (cheapest was $3,000 – most expensive was $260,000).
* 176 Lots sold in 2013 for an average sales price of $19,659 (cheapest was $800 – most expensive was $150,000).
* 167 Lots sold in 2012 for an average sales price of $21,237 (cheapest was $4,000 – most expensive was $95,000).
* 136 Lots sold in 2011 for an average sales price of $27,987 (cheapest was $4,999 – most expensive was $175,000).
2015 Quarterly Vacant Lot Sales
* 53 Lots Sold during 4th Quarter 2015 ~ Average Sales Price: $24,020 ~ Average of 391 Days on Market. Price Range: $5,000 – $80,000.
* 76 Lots Sold during 3rd Quarter 2015 ~ Average Sales Price: $26,164 ~ Average of 259 Days on Market. Price Range: $5,000 – $200,000.
* 78 Lots Sold during 2nd Quarter 2015 ~ Average Sales Price: $25,529 ~ Average of 224 Days on Market. Price Range: $4,500 – $126,000.
* 61 Lots Sold during 1st Quarter 2015 ~ Average Sales Price: $16,925 ~ Average of 262 Days on Market. Price Range: $3,000 – $80,000.
* 43 Lots Sold during 4th Quarter 2014 ~ Average Sales Price: $18,867 ~ Average of 296 Days on Market. Price Range: $4,500 – $66,000.
 Want to know what’s going on in the Ocean Shores Real Estate market more than once a quarter? Be a Fan & “Like” us at http://www.facebook.com/pages/Ocean-Shores-Real-Estate/42604953991. Thanks! By the way, the contents of this newsletter were posted on the Facebook page before you got this…
2015 Multifamily Sales
Three Multifamily buildings sold in Ocean Shores last year compared to four in 2014. Three of the apartments that sold were foreclosures. Average sales price was $260,000 up from $203,125 in 2014. Average square footage was 6,245.
2015 Commercial Property Sales
Just like 2014, Eight Commercial buildings sold last year. Price Range: $58,000 – $1,280,000.
Total Real Estate Sales for all of Grays Harbor
2015 – 1523 Transactions with a total sales volume of $181,206,327.
2014 – 1274 Transactions with a total sales volume of $140,112,276.
2013 – 1124 Transactions with a total sales volume of $116,657,672.
2012 – 1004 Transactions with a total sales volume of $101,896,506.
2011 – 1038 Transactions with a total sales volume of $112,102,309.
Grays Harbor Home Sales
1012 Homes sold in Grays Harbor County in 2015. Average price: $145,673.
912 Homes sold in Grays Harbor County in 2014. Average price: $134,410.
770 Homes sold in Grays Harbor County in 2013. Average price: $126,023.
673 Homes sold in Grays Harbor County in 2012. Average price: $122,038.
695 Homes sold in Grays Harbor County in 2011. Average price: $134,342.
Grays Harbor Home Sales Summary
Ocean Shores – 310 (+63) Homes sold for an average price of $173,143.
Aberdeen – 243 (+40) Homes sold for an average price of $105,160.
Hoquiam – 109 (-7) Homes sold for an average price of $84,292.
Elma – 90 (up 16) Homes sold for an average price of $165,075.
Montesano – 77 (-5) Homes sold for an average price of $167,474.
Westport – 40 (-7) Homes sold for an average price of $162,245.
McCleary – 31 (-10) Homes sold for an average price of $146,813.
Grayland – 25 (+7) Homes sold for an average price of $135,533.
Cosmopolis – 19 (+1) Homes sold for an average price of $130,221.
Oakville – 18 (- 6) Homes sold for an average price of $214,226.
Pacific Beach/Seabrook – 16 (down 3) Homes sold for an average price of $348,794.
Copalis Beach – 11 (+1) Homes sold for an average price of $167,691.
Copalis Crossing (+5) – 5 Homes sold for an average price of $207,100.
Ocean City – 5 (+4) Homes sold for $87,700.
Moclips – 5 (+5) Homes sold for an average price of $165,700.
Grays Harbor Condo Sales
50 Condos sold in Grays Harbor County in 2015. Average price: $131,809.
37 Condos sold in Grays Harbor County in 2014. Average price: $108,086.
34 Condos sold in Grays Harbor County in 2013. Average price: $155,346.
31 Condos sold in Grays Harbor County in 2012. Average price: $129,226.
31 Condos sold in Grays Harbor County in 2011. Average price: $137,858.
Ocean Shores vs Westport Condo Sales
Ocean Shores – 33 (up 16) Condos sold in 2015. Average price: $128,013.
Westport – 16 (down 3) Condos sold in 2015: Average price: $143,500.
 Grays Harbor Vacant Lot Sales
405 Vacant Lots sold in Grays Harbor County in 2015. Average price: $42,995.
275 Vacant Lots sold in Grays Harbor County in 2014. Average price: $33,688.
276 Vacant Lots sold in Grays Harbor County in 2013. Average price: $39,403.
258 Vacant Lots sold in Grays Harbor County in 2012. Average price: $37,583.
263 Vacant Lots sold in Grays Harbor County in 2011. Average price: $43,800.|
240 Vacant Lots sold in Grays Harbor County in 2010. Average price: $43,099.
Grays Harbor Vacant Lot Sales Summary
Ocean Shores – 268 (+77)
Pacific Beach – 23 (+19)
Westport – 20 (+5)
Elma – 16 (+2)
Grayland – 16 (+12)
Aberdeen – 14 (+1)
Montesano – 10 (+3)
Hoquiam – 9 (+3)
Oakville – 6 (+6)
Moclips – 6 (+6)
Ocean City – 5 (+3)
Taholah – 5 (+4)
Washington Coastal Community Comparisons
Residential sales activity and average sales prices on Washington’s coast were up quite a bit in all areas except the Seabrook, Pacific Beach, Moclips & Copalis Beach areas. A lot of vacant lots sold in those areas and home sales should increase in those areas next year. Below is a comparison of the four major coastal areas in Washington State:
Ocean Shores / Ocean City
* 315 Homes sold in 2015 for an average sales price of $171,786. Total volume was $54,112,736 up from $37,750,490 in 2014.
* 248 Homes sold in 2014 for an average sales price of $152,220. Total volume was $37,750,490 up nearly 24% from $30,510,942 in 2013.
* 207 Homes sold in 2013 for an average sales price of $147,396. Total volume was $30,510,942 up from $23,705,239 in 2012.
* 171 Homes sold in 2012 for an average sales price of $138,627. Total volume was $23,705,239.
* 171 Homes sold in 2011 for an average sales price of $143,482. Total volume was $24,535,361.
Long Beach / Ocean Park
* 298 Homes sold in 2015 for an average sales price of $164,619. Total volume was $49,056,470 up from $36,294,131 in 2014.
* 228 Homes sold in 2014 for an average sales price of $159,185. Total volume was $36,294,131 up 27% from $28,511,861 in 2013.
* 208 Homes sold in 2013 for an average sales price of $137,076. Total volume was $28,511,861 up from $18,726,719 in 2012.
* 156 Homes sold in 2012 for an average sales price of $120,043. Total volume was $18,726,719.
* 133 Homes sold in 2011 for an average sales price of $149,703. Total volume was $19,910,500.
Westport / Grayland
* 65 Homes sold in 2015 for an average sales price of $151,971. Total volume was $9,878,109 up from $8,401,405 in 2014.
* 65 Homes sold in 2014 for an average sales price of $129,252. Total volume was $8,401,405 up 16% from $7,234,200 in 2013.
* 59 Homes sold in 2013 for an average sales price of $122,631. Total volume was $7,234,200 up from $5,605,763 in 2012.
* 44 Homes sold in 2012 for an average sales price of $127,404. Total volume was $5,605,763.
* 62 Homes sold in 2011 for an average sales price of $126,160. Total volume was $7,821,944.
Seabrook / Copalis Beach / Moclips / Pacific Beach
* 32 Homes sold in 2015 for an average sales price of $257,931. Total volume was $8,253,800 down from $9,744,141 in 2014.
* 29 Homes sold in 2014 for an average sales price of $336,005. Total volume was $9,744,141 up 132% from $4,195,565 in 2013.
* 20 Homes sold in 2013 for an average sales price of $209,778. Total volume was $4,195,565 up from $4,010,653 in 2012.
* 21 Homes sold in 2012 for an average sales price of $190,983. Total volume was $4,010,653.
* 34 Homes sold in 2011 for an average sales price of $269,781. Total volume was $9,172,538.
Thanks for another great year!
I really need to thank all of my patient sellers & buyers along with all the great real estate agents, lenders, escrow & title folks and anyone else that I worked with in 2015 to make it another record setting year! This year I finished again at the top of the list with over 14% of all the real estate sales in Ocean Shores. I was also tops in Grays Harbor County with over 5% of the market share. This has been my fourth year at John L. Scott and I still can’t tell you what a great office, company and atmosphere we have. Additionally, the johnlscott.com website and the John L. Scott app are great! John L. Scott is the #1 top-producing brokerage in Ocean Shores and all of Grays Harbor County with the most brokers, listings and sales – just over 13% of all the real estate business in Grays Harbor County last year. Thank you!
2015 Ocean Shores Real Estate Brokerage Rankings
John L. Scott – 33%
Windermere – 25%
Laurie Christian – 8%
North Beach – 7%
Premier Realty – 3%
Coldwell Banker – 4%
cityofoceanshores.com Update
www.cityofoceanshores.com is updated and a sweet website to assist you in buying, living and enjoy Ocean Shores. Please check it out. Thank you!
 Upcoming Things to Do in Ocean Shores
Click the picture for something to do every day in Ocean Shores & Grays Harbor
Life’s @ the Beach!
Jeff Daniel / Managing Broker
John L. Scott Ocean Shores
Cell Phone: 360.581.9020
711 Point Brown Ave NW
Ocean Shores, WA 98569
360.289.2454 (fax)
This message (including attachment if any) is confidential and may be privileged. If you have received this message by mistake please notify the sender by return e-mail and delete this message from your system. Any unauthorized use or dissemination of this message in whole or in part is strictly prohibited. All real estate data is taken from the NWMLS.com website.
